How Fast is Strava Growing?
|
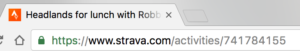
I’ve written before about Strava, the ride sharing app that’s become the most important social network in cycling. Previously I sampled Strava’s member numbers to estimate the number of active and premium members and to survey Strava’s global reach. In this post I explore Strava’s activity numbers to measure its growth rate. The key to this methodology is Strava’s simple system of assigning URLs to each activity uploaded. Strava creates the URL sequentially, adding one each time a new activity is uploaded. For example, my ride yesterday was the 741,784,155th activity uploaded to the site, and it was assigned the URL http://www.strava.com/activities/741784155.
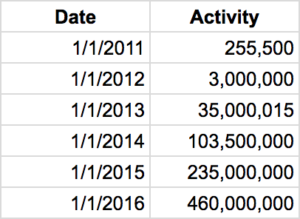
With a bit of work one can use this system to find the date when Strava passed any given milestone of activity numbers. There’s a bit of noise in the system because activities are numbered by when they are uploaded, not by when they began or ended. If a user waits a week to post an activity it can throw off the sequence. But most activities are uploaded with a day or two, and it’s pretty easy to sample several rides in sequence to figure out the upload date from looking at the activity date. This distortion was greater in the early years, when some new members (like me) began by importing hundreds of activities that were recorded on other sites. All the data used for this analysis can be replicated by reference to my source spreadsheet on Google Docs. and is available publicly at www.strava.com. To begin I just entered a bunch of round numbers into the Strava Activity URL and found the date of the associated activity.
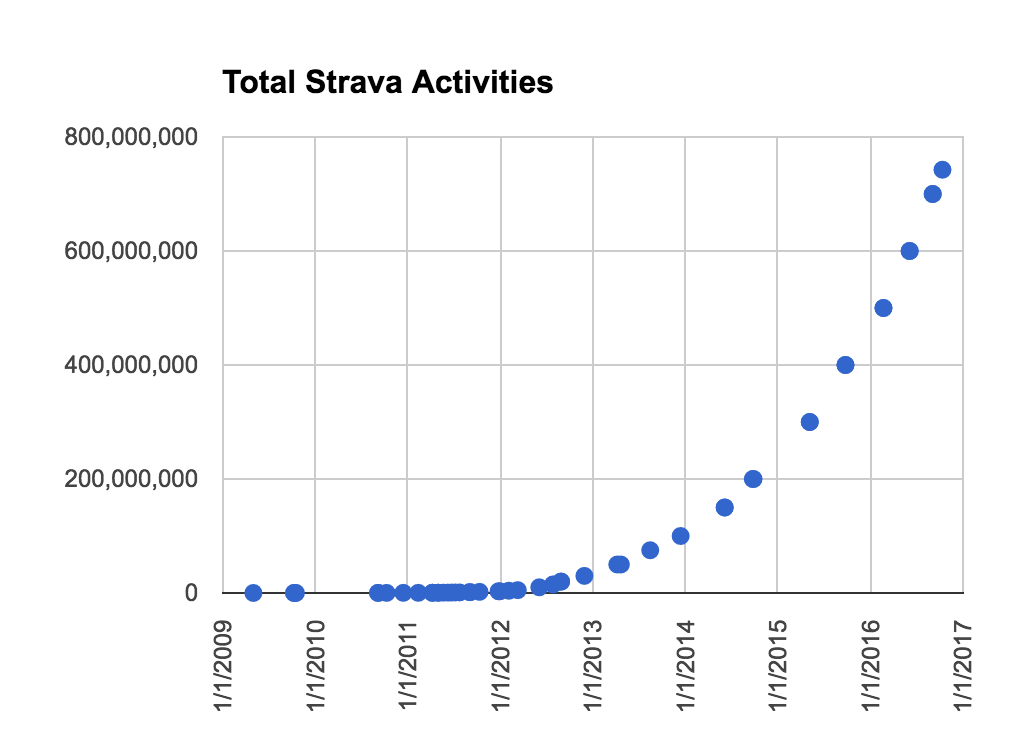
I hope these tables are easy to interpret. For example, Strava’s millionth activity was uploaded around July 2011 (see log scale chart on right). The two-hundred-millionth activity was a run on Sept. 27, 2014. I then used these curves plus a little trial and error to find the number of activities that had been posted on January 1 of each year. There’s a bit of approximation involved. At the current rate it looks like by January 1, 2017 Strava will reach activity number 820 million.
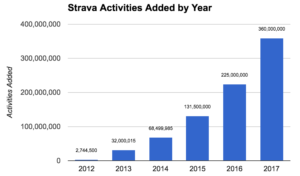
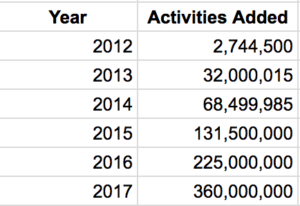
From here, I just subtracted the previous year’s total from the current year to find out how many activities had been added per year.
This is impressive and surprising – Strava is still growing very quickly when measured by the number of activities added to the site. It’s on track to add 60% more activities in 2016 than in 2015. The Billionth Activity In a future post I hope to update and refine my member survey and compare it to the activity numbers to get a sense of engagement per active user. I’m glad to see that Strava continues to thrive and to reach more and more athletes. I always get inspired when I get a glimpse of all these wonderful athletes worldwide.
|